multiplot
|
Contents: Description, Arguments, Usage, Examples, Images, Related Functions Supported Under Version: > 1.73 Current Davinci Version: 2.27 64-bit Safe: No
Description WARNING: multiplot() has changed recently! Check your davinci version for compatibility. Use multiplot_old for davinci version < 1.73.
Arguments and Return Values Arguments: optional values for rows and columns and a flag to make columns fill completely before continuing to the next column. Return Value: None. Plot activates multiplot option.
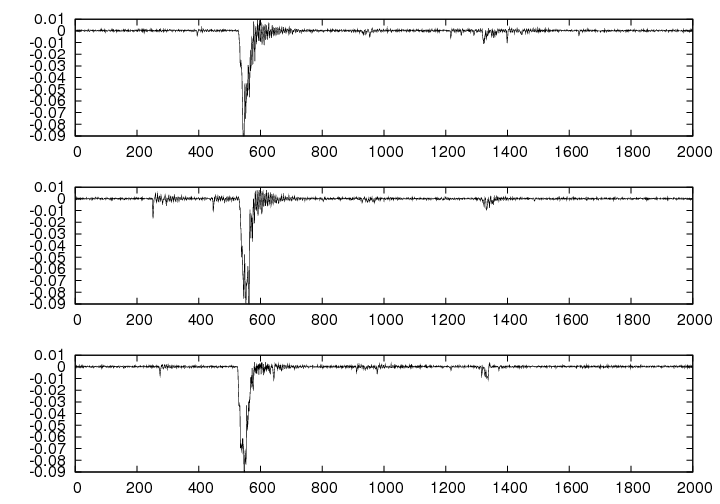
Usage Syntax: multiplot(rows=INT, columns=INT, columnsfirst=BOOL) rows: the number of rows of independent plots you want the Gnuplot canvas to have. columns: the number of columns of independent plots you want the Gnuplot canvas to have. columnsfirst: is an optional flag to fill a column completely before moving on to another. Default is no (0). Use the command nomultiplot() to turn off the multiplot functionality and return to normal plotting.
Examples dv> multiplot(rows=3,columns=1) dv> xplot(a[,1]) dv> xplot(a[,2]) dv> xplot(a[,3]) dv> nomultiplot()
|
DavinciWiki Mini-Nav Bar Contents
Contact Developers
All other topics
Related Functions
Recent Core Changes Modified On: 02-26-2014 |
