Plotting Spectra with pplot
From DavinciWiki
|
Contents: Description, Arguments, Usage, Examples, Sub-Functions, Related Functions Supported Under Version: > 1.04 Current Davinci Version: 2.27 64-bit Safe: No
Description Run through a variety of pplot() cases.
Arguments and Return Values Arguments: none. Return Value: none. GnuPlot is launched and displays graph.
Usage Syntax: pplot_tutorial()
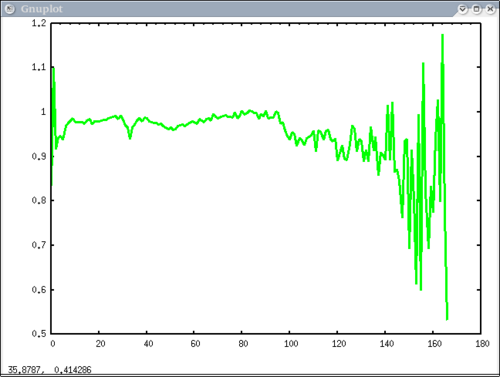
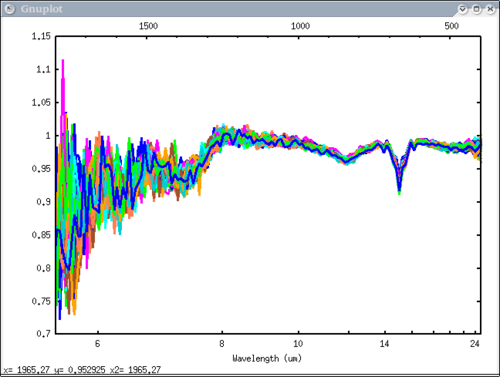
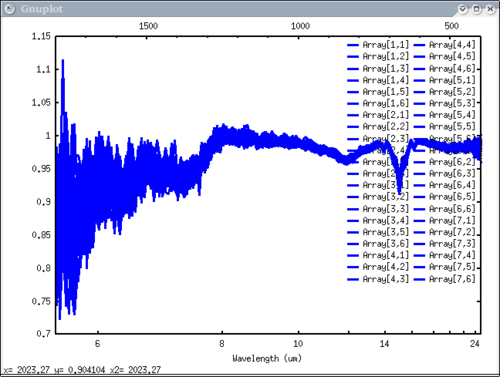
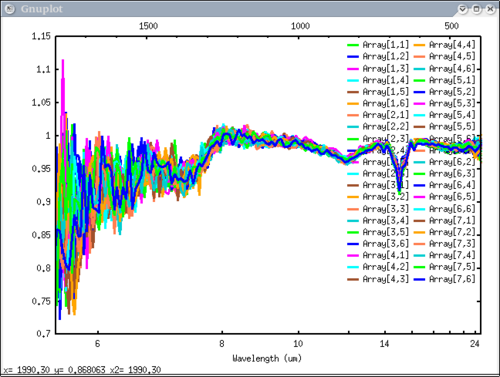
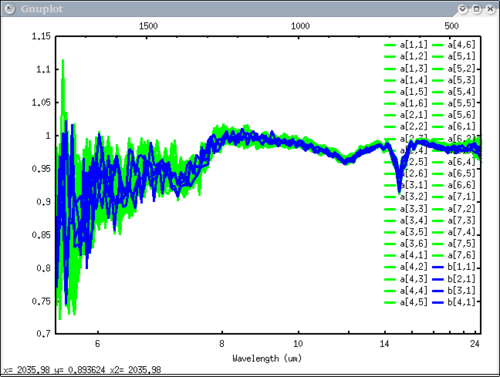
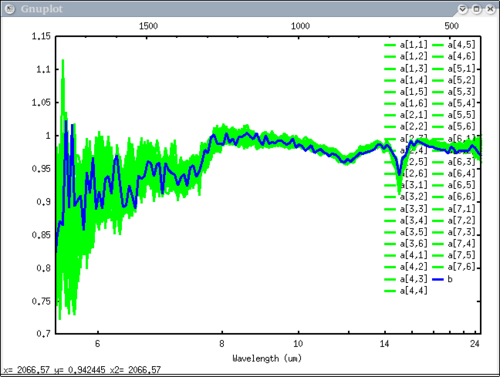
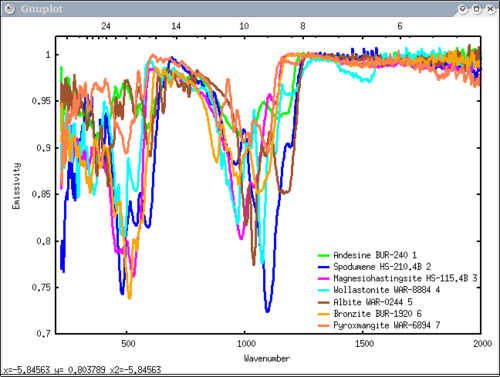
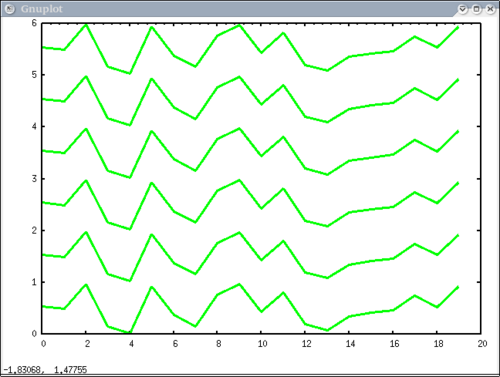
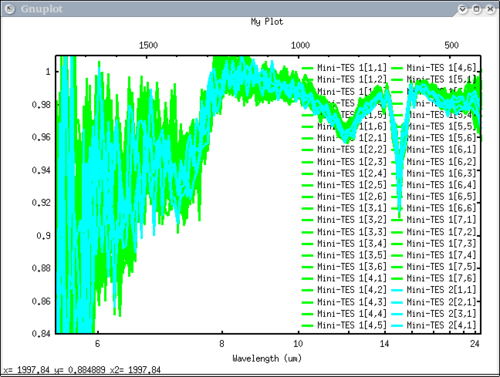
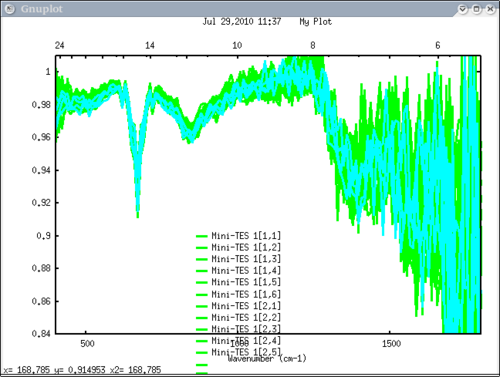
Examples See pplot_tutorial() or pplot_examples() for sample cases. Each image corresponds to the listed command. dv> pplot_tutorial() .......................................... doing broadband .......................................... Simplest possible case: 1 vector, no colors, no labels - like xplot "pplot(array[1,1])" pausing Next simplest case: 1 array, no colors, no labels - will cycle colors automatically Use standard mtes x-axis "pplot(array, mtes=1)" pausing Simple case: 1 data element (array), 1 color (for all), 1 label, standard mini-TES plot Note: Order doesn't matter for colors and labels) "pplot(array, 'Array', 2, mtes=1)" pausing 1 array, 1 label, no colors - will auto cycle through colors and add index to label "pplot(array, 'Array', mtes=1)" pausing 2 data elements, 2 colors, 2 labels in structures - single color and single label for each data element
"pplot({array, xx}, {1,2}, {'a', 'b'}, mtes=1)"
pausing
2 data elements (1 array & 1 vector), 2 colors, 2 labels - single color and single label for each data element
"pplot({array, array[1,1]}, {1,2}, {'a', 'b'}, mtes=1)"
pausing
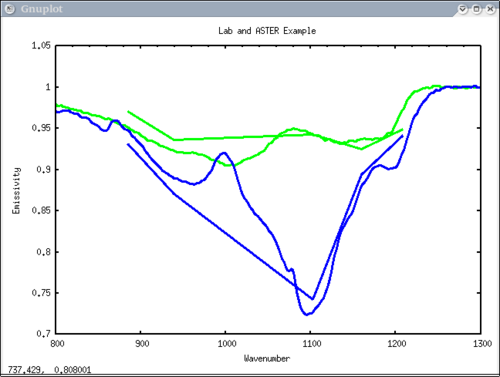
2 different data elements with different x axes
"pplot({asudata[1:2], asterdata[1:2]}, xaxis={xlab1, xastercm}, x1=800, x2=1300, xlabel='Wavenumber', \
ylabel='Emissivity',  plot_title = 'Lab and ASTER Example')"
pausing
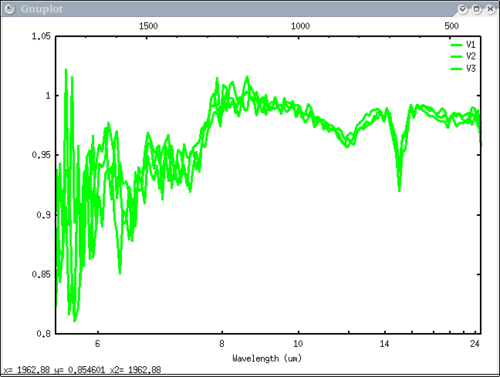
3 vectors, 3 labels, no colors - will auto cycle through colors
"pplot({a,b,c}, {'V1', 'V2', 'V3'}, mtes=1)"
pausing
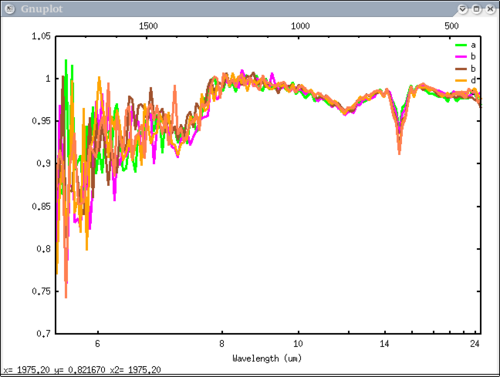
Just 1 data element with 5 vectors in x, 5 labels, 5 colors
"pplot(array[1:5, 1], {1,3,5,6,7}, {'a', 'b', 'b', 'd','e'}, mtes=1)"
pausing
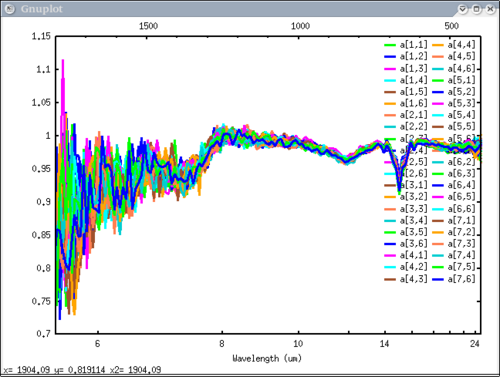
1 data element, 1 label, no color specified, auto loop through colors and index label 'a'
"pplot({array}, {'a'}, mtes=1)"
pausing
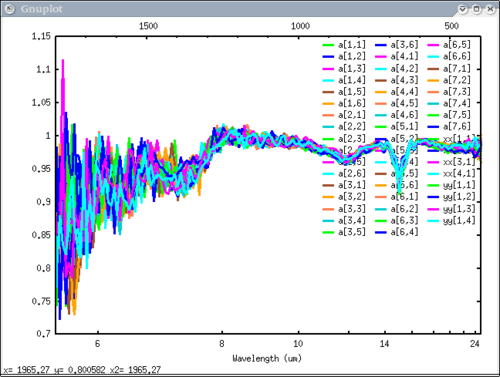
3 data elements, no color specified, auto loop through colors and index labels 'a', 'xx', and 'yy'
"pplot({array,xx, yy}, {'a','xx', 'yy'}, mtes=1)"
pausing
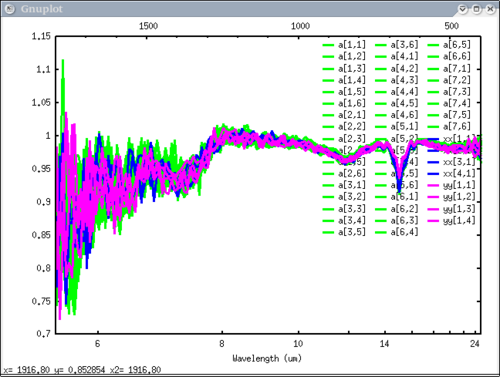
3 data elements, colors WERE specified, one color for each and 1 label for 'a', 'xx', 'yy'
"pplot({array,xx, yy}, {1,2,3}, {'a','xx', 'yy'}, mtes=1)"
pausing
ASU spectral structure example
"pplot(spec_struc)"
pausing
data in x and y case
Case of 3 data elements in x and 3 in y
"pplot({a, a+1, a+2, ay+3, ay+4, ay+5})"
pausing
**** Now I'll demonstrate the more specific functions ***********

Plot title, key location, mini-TES and emissivity default
"pplot({array, xx}, {1,4}, {'Mini-TES 1','Mini-TES 2'}, plot_title='My Plot', key = 'right bottom', mtes=1, emiss=1)"
pausing
Specific key location, Wavenumber on bottom x axis, date
"pplot({array, xx}, {1,4}, {'Mini-TES 1','Mini-TES 2'}, plot_title='My Plot', key = '900, .9', mtes=1, emiss=1, cm=1, date=1)"
pausing
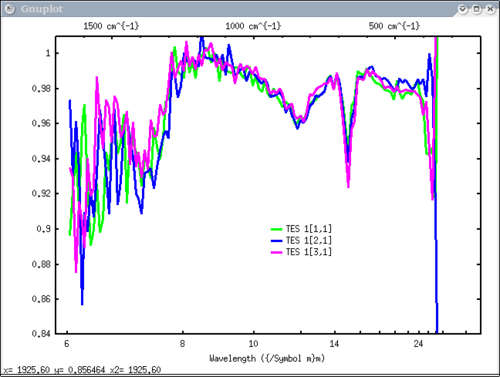
TES default plot, wavelength on bottom x axis, ps, pdf
"pplot({etes[1:3,1]}, {'TES 1'}, key = '900, .9', tes=1, emiss=1, wave=1, ps='./junk.ps', pdf=1)"
Outputting postscript to file: ./junk.ps
Wavelength on the bottom
converting to pdf file ./junk.ps.pdf
Using postscript line colors from file: /u/cedwards/.Xdefaults
pausing
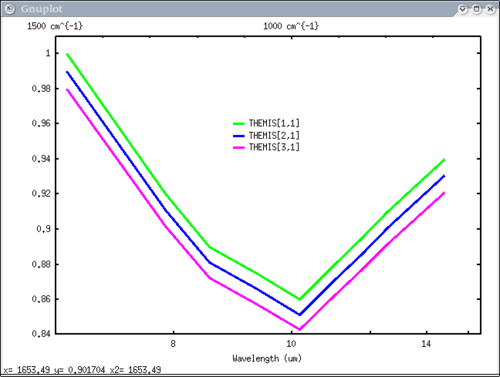
THEMIS default plot, wavelength on bottom x axis
"pplot(emthemis_cube, 'THEMIS', key = '1100, .96', themis=1, emiss=1)"
pausing
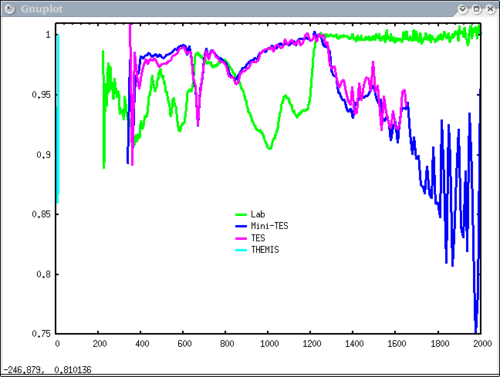
Resample example - lab, mtes, tes, and themis spectra
"pplot({labdata1, ave_mtes, ave_tes, emthemis},{1,2,3,4}, {'Lab','Mini-TES','TES','THEMIS'}, \
key='900,.85', xaxis={xlab1, xmtes, xtes, xthemis}, emiss=1, y1=.75)"
pausing
|
DavinciWiki Mini-Nav Bar Contents
Contact Developers
All other topics
Related Functions
Recent Core Changes Modified On: 09-08-2010 |
